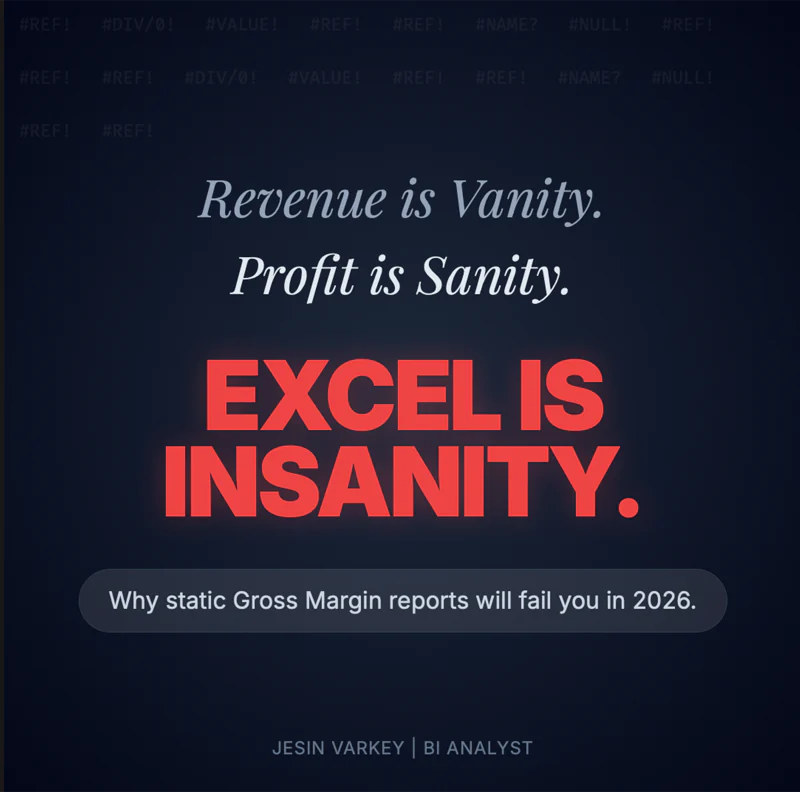
Clarity before complexity.
Define the decision, the owner and the action threshold before choosing a visual or building a model.
I design governed Power BI and Microsoft Fabric systems—from lakehouse and semantic model to the executive view where the next move becomes clear.

The work begins with the question leadership must answer—not with a chart type. Every engagement is designed around confidence, speed and adoption.
Define the decision, the owner and the action threshold before choosing a visual or building a model.
Revenue, margin and performance should mean the same thing in every meeting, report and team.
Executive simplicity and analytical depth can coexist when the experience is designed around real workflows.
Documentation, governance and handover are part of the system—not optional work after launch.
Seven public systems, engineered from the decision backwards. Open the work, inspect the thinking and see how complex operations become clear.
Explore all eleven systemsReal estate intelligence
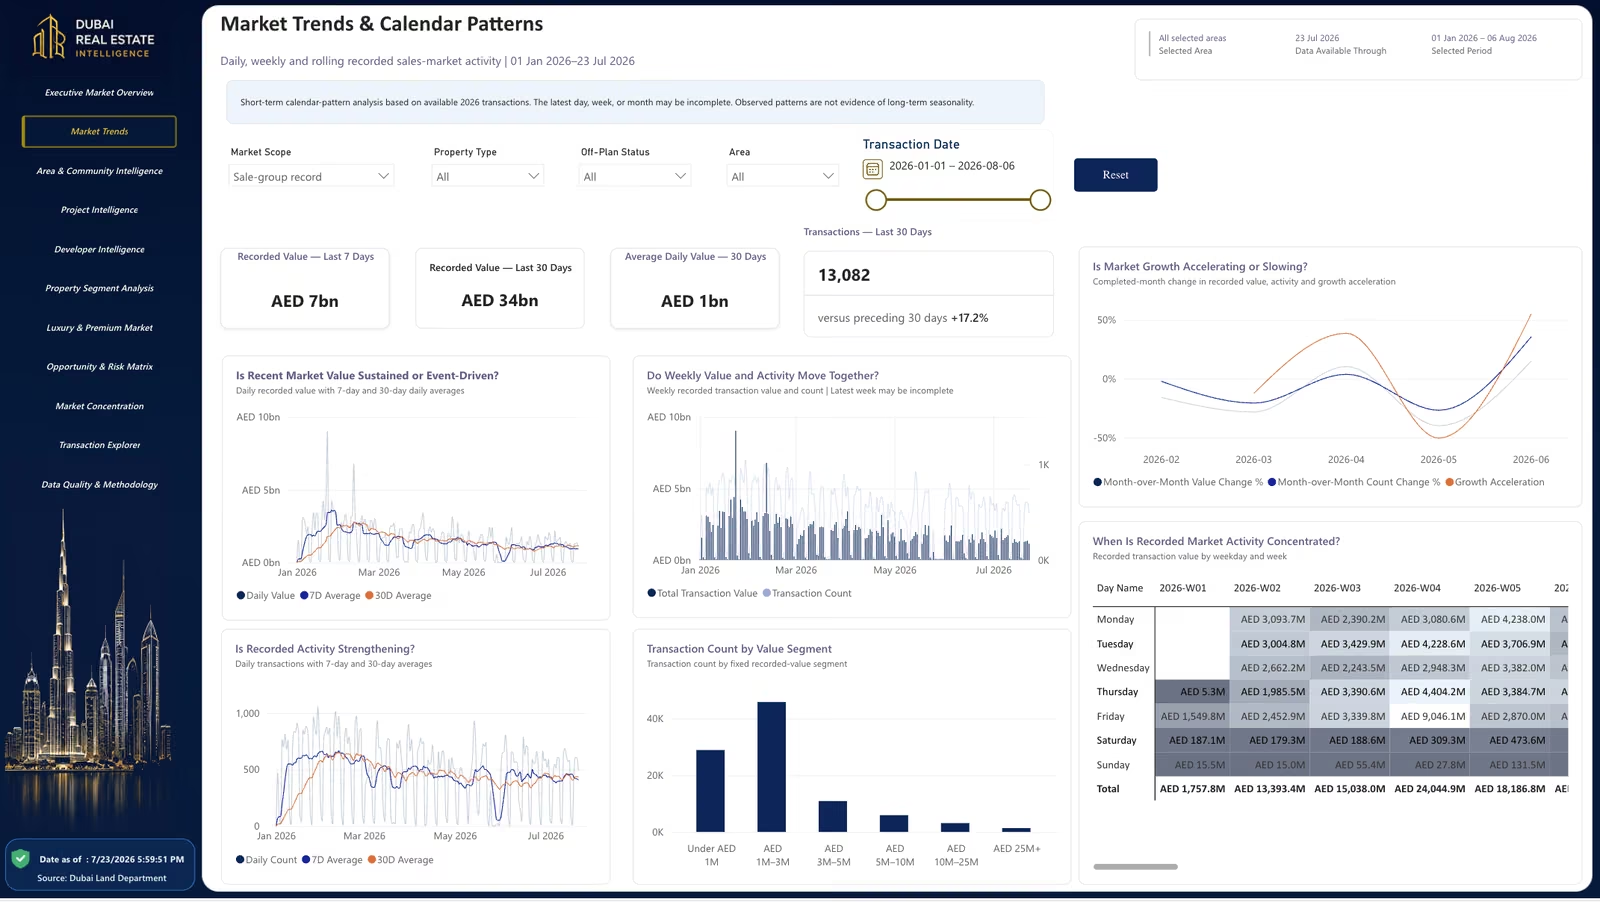
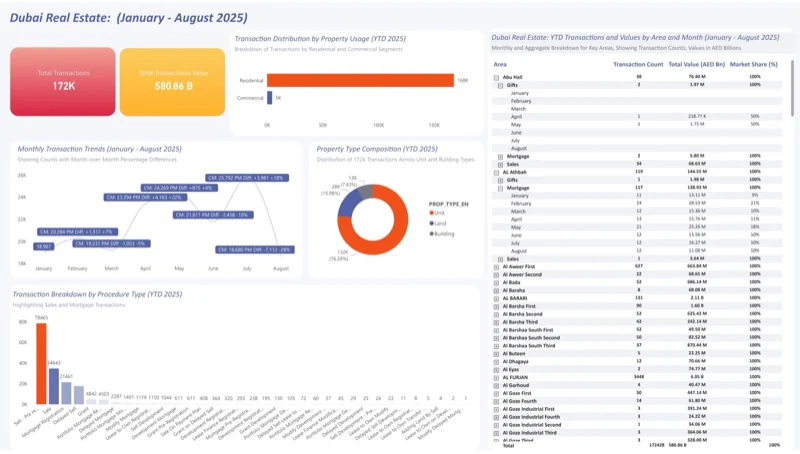
Turns Dubai Land Department transaction data into a clear view of market momentum, pricing, concentration and risk.
Open case study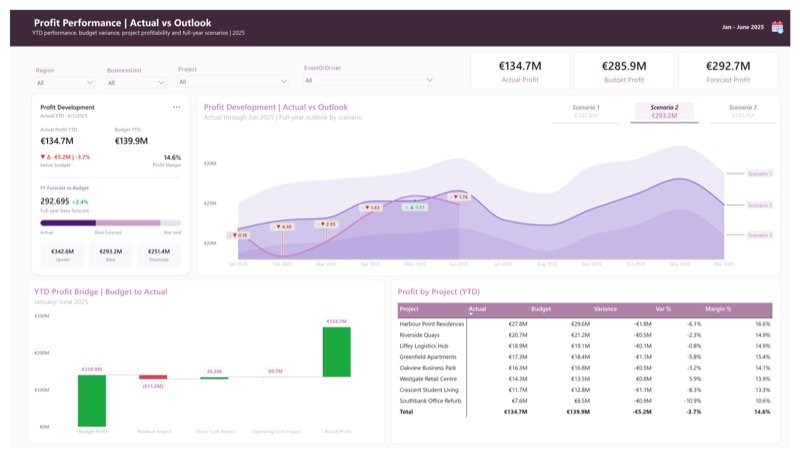 Explore project ↗
Connects YTD actual profit, budget expectations, project-level profitability and full-year scenario outlook.

Explores long-term longevity progress, country convergence, healthy life years, child survival and health-spending context.
 Explore ↗
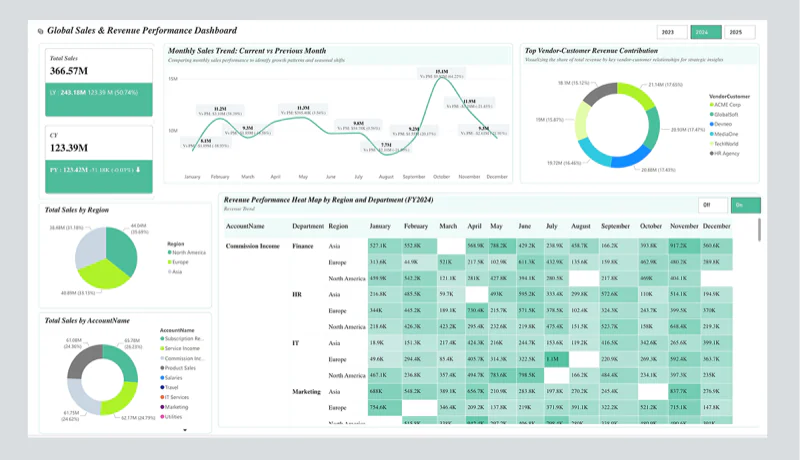
Turn regional revenue movement and customer concentration into a clear management agenda.
 Explore ↗
Find where market movement and capital allocation intersect.
 Explore ↗
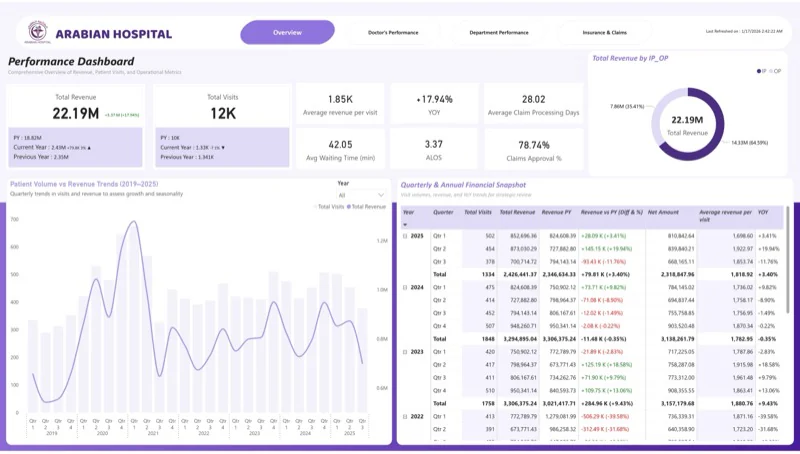
Surface denial patterns and focus revenue-cycle attention.
 Explore ↗
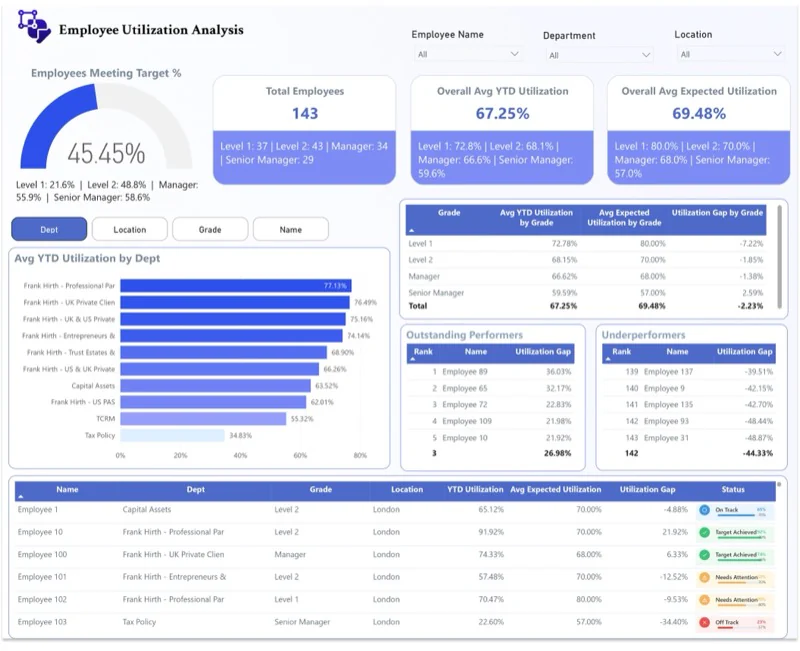
Connect utilization, workload and delivery capacity.
Public portfolio systems demonstrate analytical and experience-design capability. Confidential client outcomes are never presented as public claims.
See the complete project archiveStart with diagnosis, engineer the complete decision layer, or add senior BI leadership without a full-time hire.
A focused review of reporting friction, model risk and decision gaps.
A governed Power BI and Fabric layer engineered around the decisions that matter.
Senior analytics direction for teams that need governance, prioritization and delivery leadership.
You should always know what is being decided, built, validated and handed over.
Map the decisions, stakeholders, data sources and current reporting friction.
Agree KPI definitions, architecture, success criteria and the smallest valuable release.
Build the governed model and decision experience in reviewable increments.
Validate with users, document the system and transfer capability to your team.
This directional estimate converts repetitive reporting time into annual team capacity. It is a conversation starter—not a guaranteed savings claim.
See how an engagement worksAED 19,800 of team capacity is consumed each week.
I work at the layer between raw business data and leadership action: shaping the model, defining the metrics and designing the experience people will actually use.
My background across data and sales keeps the work commercially grounded. The goal is not a more impressive dashboard. It is a decision system your team understands and can sustain.
Short perspectives on metrics, operating visibility and the habits that make analytics useful.